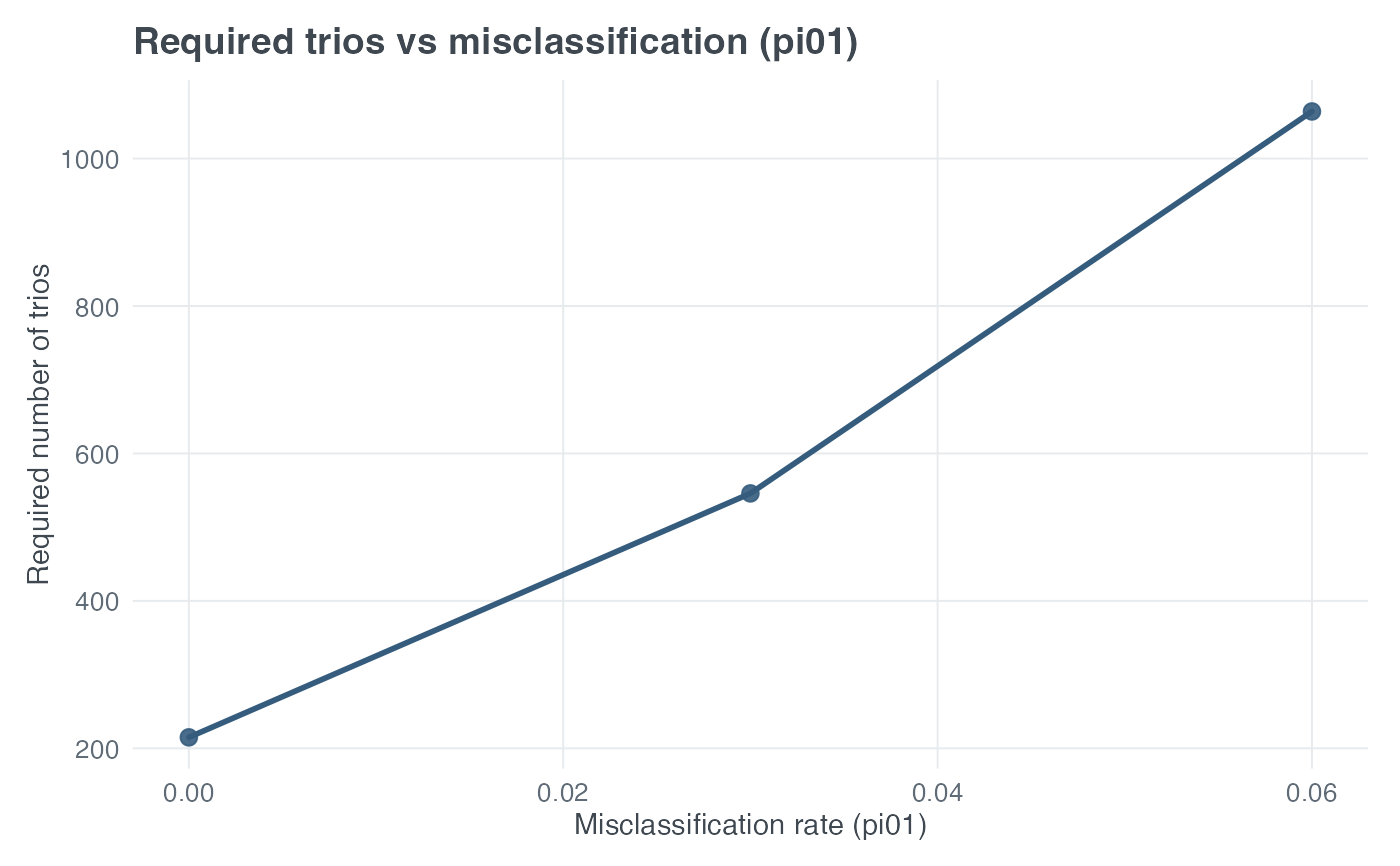
Plot TDT MSSN Sensitivity to Phenotype Misclassification
Source:R/tdt_functions.R
plot_tdt_mssn_phenotype_misclassification.RdPlot required number of trios vs misclassification rate (pi01), holding heterogeneity fixed.
plot_tdt_mssn_phenotype_misclassification(
  pd,
  prev,
  R1,
  R2,
  alpha = 0.05,
  delta_prime = 1,
  target_power,
  misclass_seq = seq(0, 0.15, by = 0.01),
  heter_fixed = 0,
  title = "Required trios vs misclassification (pi01)"
)
Arguments
- pd
Disease allele frequency.
- prev
Disease prevalence.
- R1
Genotype relative risk for heterozygotes.
- R2
Genotype relative risk for risk homozygotes.
- alpha
Significance level.
- delta_prime
Linkage disequilibrium scaling parameter.
- target_power
Numeric. Desired power for sample size calculation.
- misclass_seq
Numeric vector. Sequence of misclassification rates.
- heter_fixed
Numeric. Heterogeneity rate held fixed (default 0). (Other params same meaning as in plot_tdt_power_phenotype_misclassification.)
- title
Plot title.
Value
A ggplot object, returned invisibly after it is printed.
Details
The x-axis is phenotype misclassification probability
\(\pi_{01}\). The y-axis is MSSN, the required number of affected trios
returned by tdt_mssn() for fixed target_power.
heter_fixed and all genetic-model parameters remain fixed.
See also
Examples
# Required sample size sensitivity to phenotype misclassification
plot_tdt_mssn_phenotype_misclassification(
  target_power = 0.80,
  pd   = 0.30,
  prev = 0.05,
  R1   = 1.5,
  R2   = 2.25,
  misclass_seq = c(0, 0.03, 0.06),
  heter_fixed  = 0
)