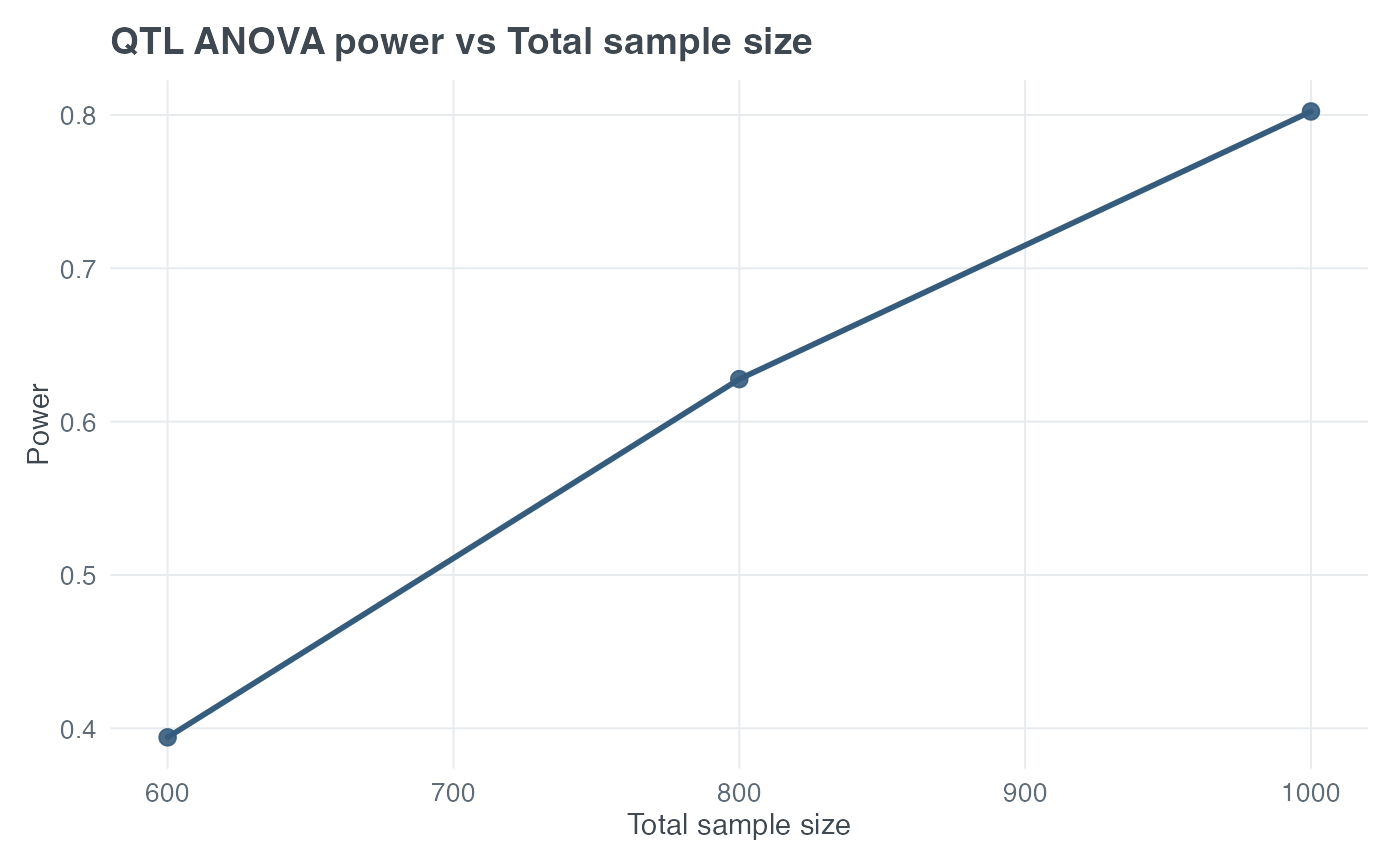
Sweeps one model or design parameter and repeatedly calls
qtl_anova_power() for a single continuous quantitative trait.
plot_qtl_anova_power(
  x_var,
  x_values,
  title = NULL,
  x_label = NULL,
  y_label = NULL,
  return_data = FALSE,
  ...
)
Arguments
- x_var
Parameter to vary. One of
"N","alpha","qtl_var","tau", or"pd".- x_values
Numeric vector of at least two finite x-axis values.
- title
Optional plot-title override.
- x_label
Optional x-axis-label override.
- y_label
Optional y-axis-label override.
- return_data
Logical. If
TRUE, returns plotting data rather than a ggplot object.- ...
Fixed arguments passed to
qtl_anova_power().
Value
A ggplot object, or a data frame with the swept parameter and power
if return_data = TRUE.
Details
The x-axis is x_values for the selected x_var; the
y-axis is one-way ANOVA power from qtl_anova_power(). Every argument
in ... remains fixed while the selected parameter is swept.
See also
Examples
plot_qtl_anova_power(
  x_var = "N", x_values = c(600, 800, 1000),
  alpha = 0.0001, qtl_var = 0.025, tau = 0.5, pd = 0.15
)