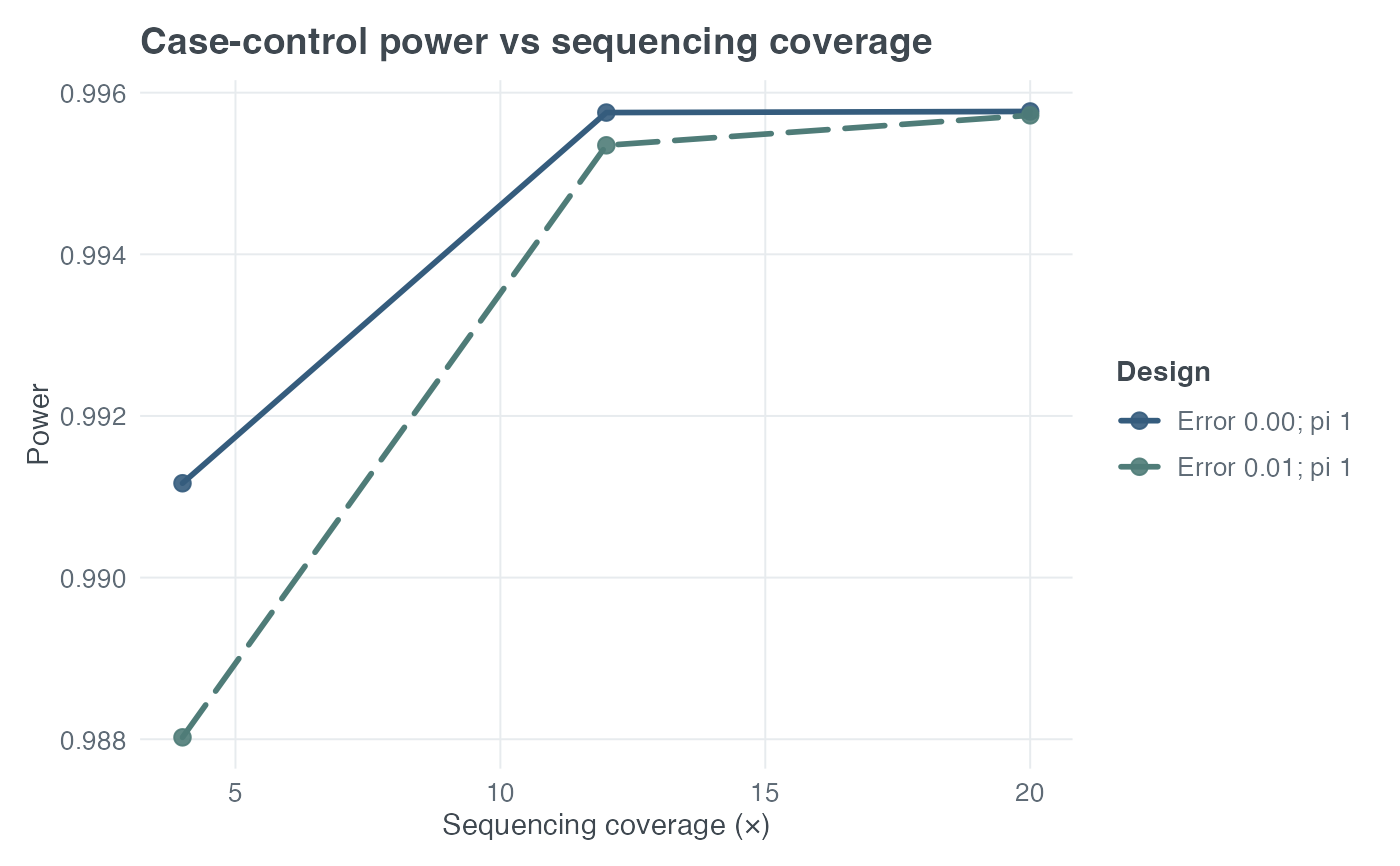
Plots prospective analytic power against equal fixed sequencing coverage for either a case-control sequencing trend design or a TDT1-NGS design. Exact values are obtained by repeated calls to the corresponding validated public design function.
plot_ngs_power(
  design = c("cc", "tdt"),
  coverage,
  seq_error,
  target_power = NULL,
  return_data = FALSE,
  ...
)
Arguments
- design
Either
"cc"forcc_ngs_power()or"tdt"fortdt_ngs_power().- coverage
Non-empty numeric vector of integer fixed sequencing depths. TDT1-NGS requires coverage of at least 2.
- seq_error
Non-empty numeric vector of symmetric per-read sequencing error probabilities in \([0,0.5)\). Multiple values produce separate curves.
- target_power
Optional finite scalar in \((0,1)\). If supplied, a dashed horizontal reference line is added without changing calculations.
- return_data
Logical. If
TRUE, return the exact plotting data rather than a ggplot object.- ...
Fixed arguments passed to
cc_ngs_power()ortdt_ngs_power(). For case-control designs,locus_het = TRUEpermits a vector ofpivalues. TDT1-NGS accepts a fixedlocus_hetandheter_ratethrough...; its public convention isheter_rate = 1 - pi.
Value
A ggplot object with exact results in plot$data, or a data
frame when return_data = TRUE.
Details
Case-control output retains coverage, sequencing error, locus-homogeneity
fraction, sample sizes, NCP, and power. At pi = 0, the exact null
point is retained with NCP zero and power equal to alpha. TDT1-NGS uses raw
read-count probabilities and does not use the case-control hard-call model.
Coverage is fixed and equal for the relevant study members. These plots do not model variable/BGE coverage distributions, cost optimization, or sample-specific depth. They introduce no simulation and delegate all statistical calculations to public PAWEH sequencing design APIs.